
Population of Kyrgyzstan: Demographics, Migration and Regional Distribution
Last updated: August 2026. Data compiled from official statistical sources.
People often talk about Kyrgyzstan as a small mountain country. Geographically that is true. But demographically the picture is more dynamic than many assume. Population growth has remained steady for decades, driven primarily by high birth rates and a relatively young age structure.
Understanding how many people live in Kyrgyzstan — and where they live — requires looking beyond a single number. Regional distribution varies widely, urban centers continue to expand, and internal migration gradually reshapes the demographic map.
According to data from the National Statistical Committee of the Kyrgyz Republic, the country’s population continues to grow each year, with the largest concentrations located in the southern regions and in the capital city of Bishkek.
Current Population of Kyrgyzstan
Recent demographic estimates show that Kyrgyzstan’s population continues to expand steadily. According to international datasets compiled from national statistics, the country’s population reached approximately 7.22 million people in 2024.
More recent updates from national authorities indicate that the population approached 7.4 million residents in 2025, confirming that natural population growth remains the main driver of demographic expansion.
Annual population growth remains relatively high by regional standards. Recent estimates place Kyrgyzstan’s population growth rate at roughly 1.7% per year, reflecting strong birth rates and a relatively young population structure.
Compared with many countries in Eastern Europe and Central Asia that face demographic decline, Kyrgyzstan continues to experience steady population expansion.
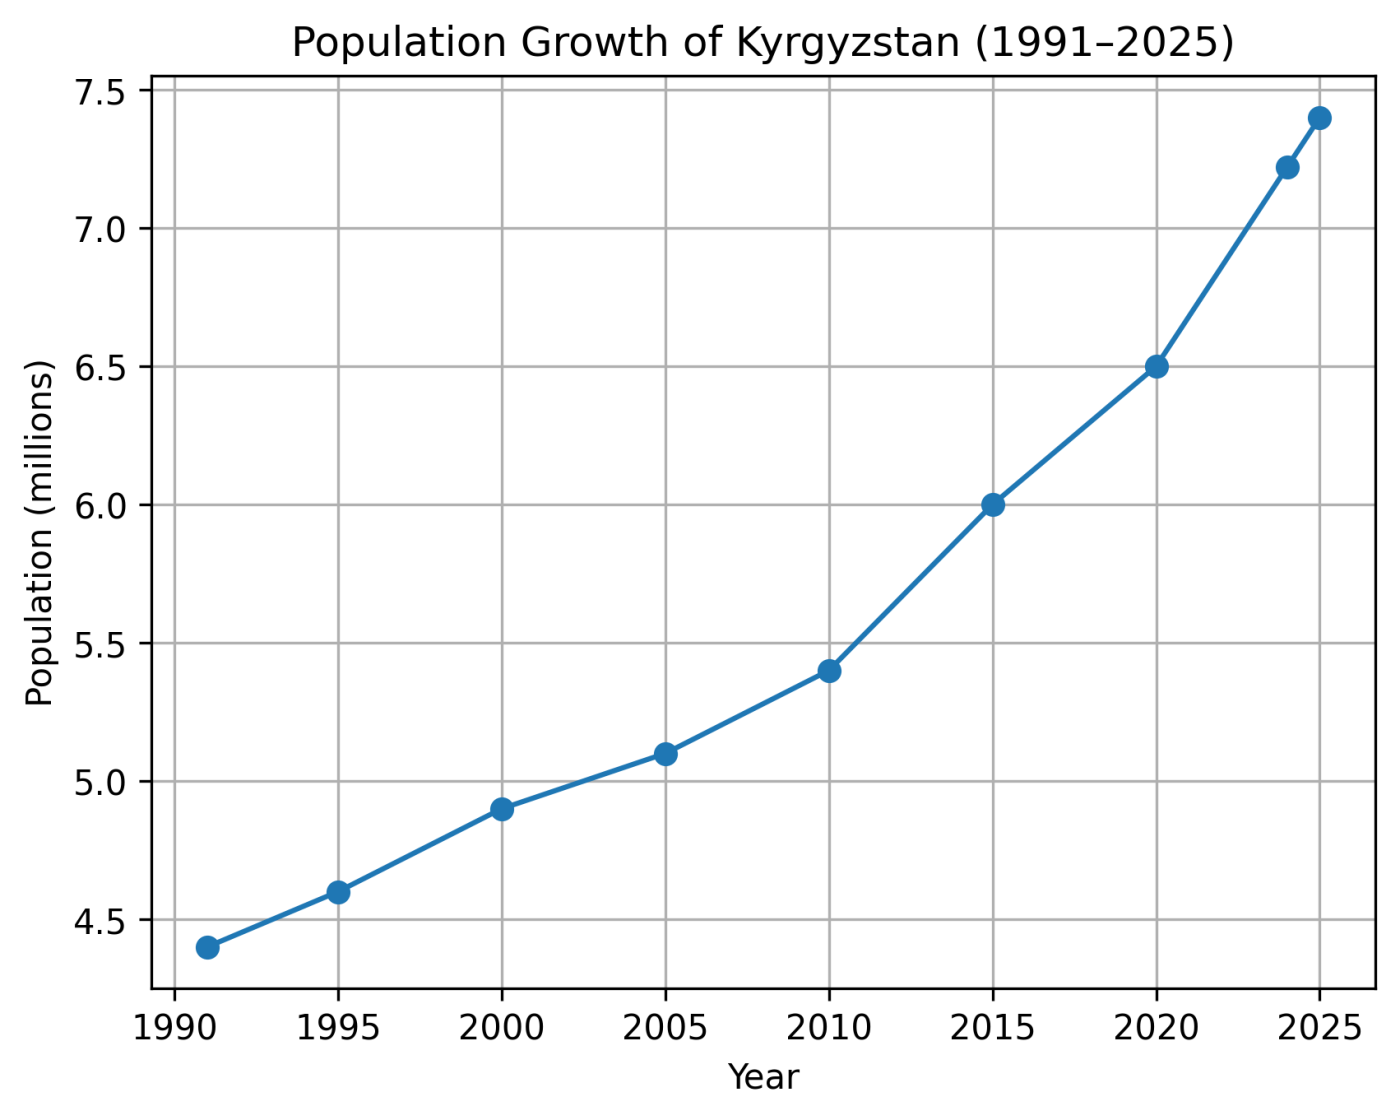
Sources: World Bank population data; National Statistical Committee.
Population by Region
Kyrgyzstan’s population is distributed across seven regions (oblasts) and two major cities with special administrative status: Bishkek and Osh. While rural areas still account for a large share of residents, urban growth has accelerated in recent years.
The following table shows the permanent population by region between 2021 and 2025.
| Region | 2021 | 2022 | 2023 | 2024 | 2025 |
|---|---|---|---|---|---|
| Batken Region | 549,000 | 559,500 | 570,900 | 583,400 | 594,700 |
| Jalal-Abad Region | 1,266,300 | 1,288,400 | 1,311,000 | 1,335,800 | 1,358,500 |
| Issyk-Kul Region | 527,700 | 533,800 | 538,400 | 544,400 | 549,800 |
| Naryn Region | 303,400 | 306,500 | 308,400 | 312,100 | 314,900 |
| Osh Region | 1,410,800 | 1,435,500 | 1,460,400 | 1,393,600 | 1,416,700 |
| Talas Region | 267,600 | 270,300 | 273,500 | 277,100 | 280,500 |
| Chuy Region | 1,038,700 | 1,054,500 | 1,068,700 | 957,600 | 971,300 |
| Bishkek City | 1,088,300 | 1,113,800 | 1,145,000 | 1,294,800 | 1,321,900 |
| Osh City | 337,800 | 350,600 | 361,300 | 463,100 | 473,500 |
Regional figures for 2024 and later are not directly comparable with earlier years because of Kyrgyzstan’s administrative-territorial reform and the expansion of Bishkek and Osh city boundaries.
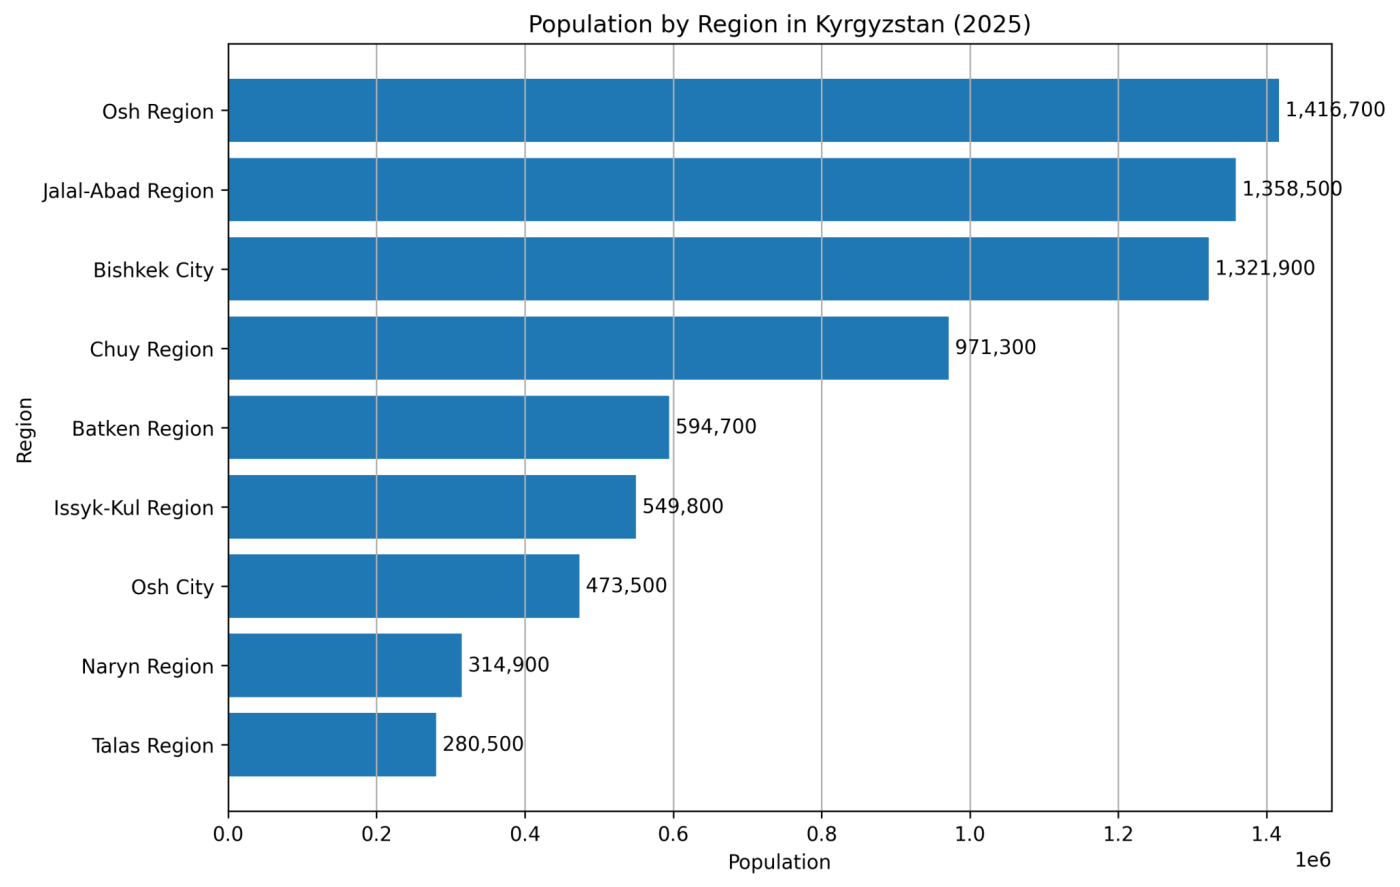
Several patterns stand out in the data. The southern regions — particularly Osh and Jalal-Abad — remain the most densely populated parts of the country. These areas historically maintained higher birth rates and stronger rural population growth.
At the same time, Bishkek shows the fastest urban expansion. As the political, economic, and educational center of Kyrgyzstan, the capital continues to attract internal migration from across the country.
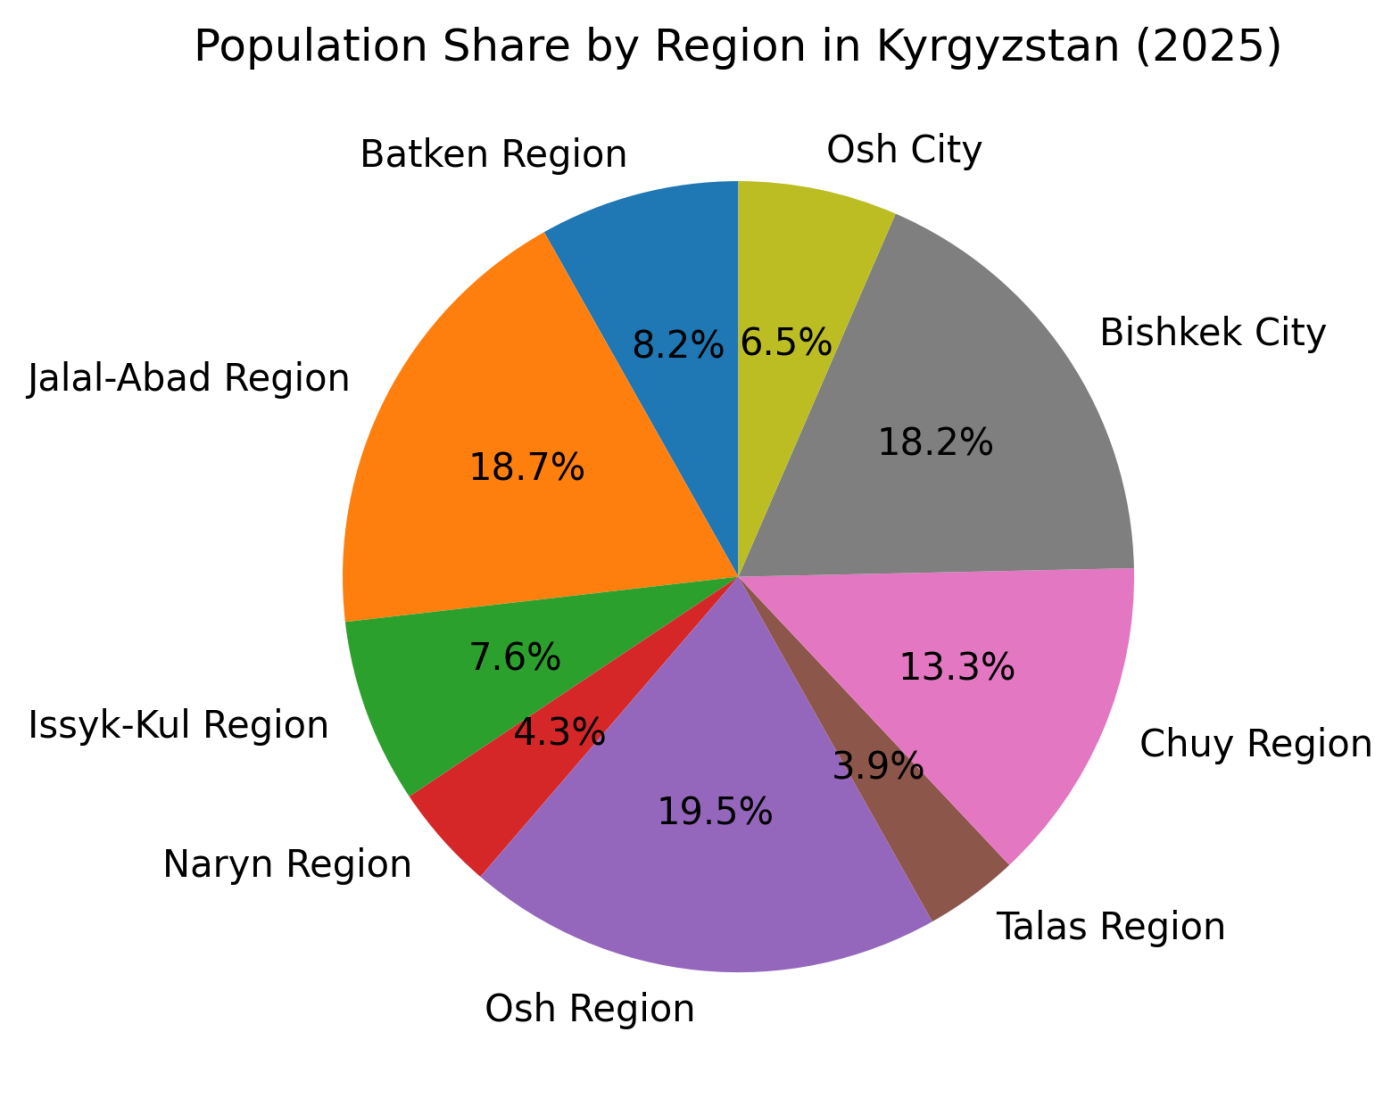
Smaller regions such as Naryn and Talas remain less populated, reflecting their mountainous geography and limited urban infrastructure.
Population Distribution Patterns
Population distribution in Kyrgyzstan follows geography closely. Valleys and fertile agricultural zones host the largest settlements, while high mountain regions maintain far lower population density.
- The Fergana Valley areas in the south support large rural populations.
- The Chuy Valley in the north concentrates economic activity around Bishkek.
- Mountain regions such as Naryn remain sparsely populated.
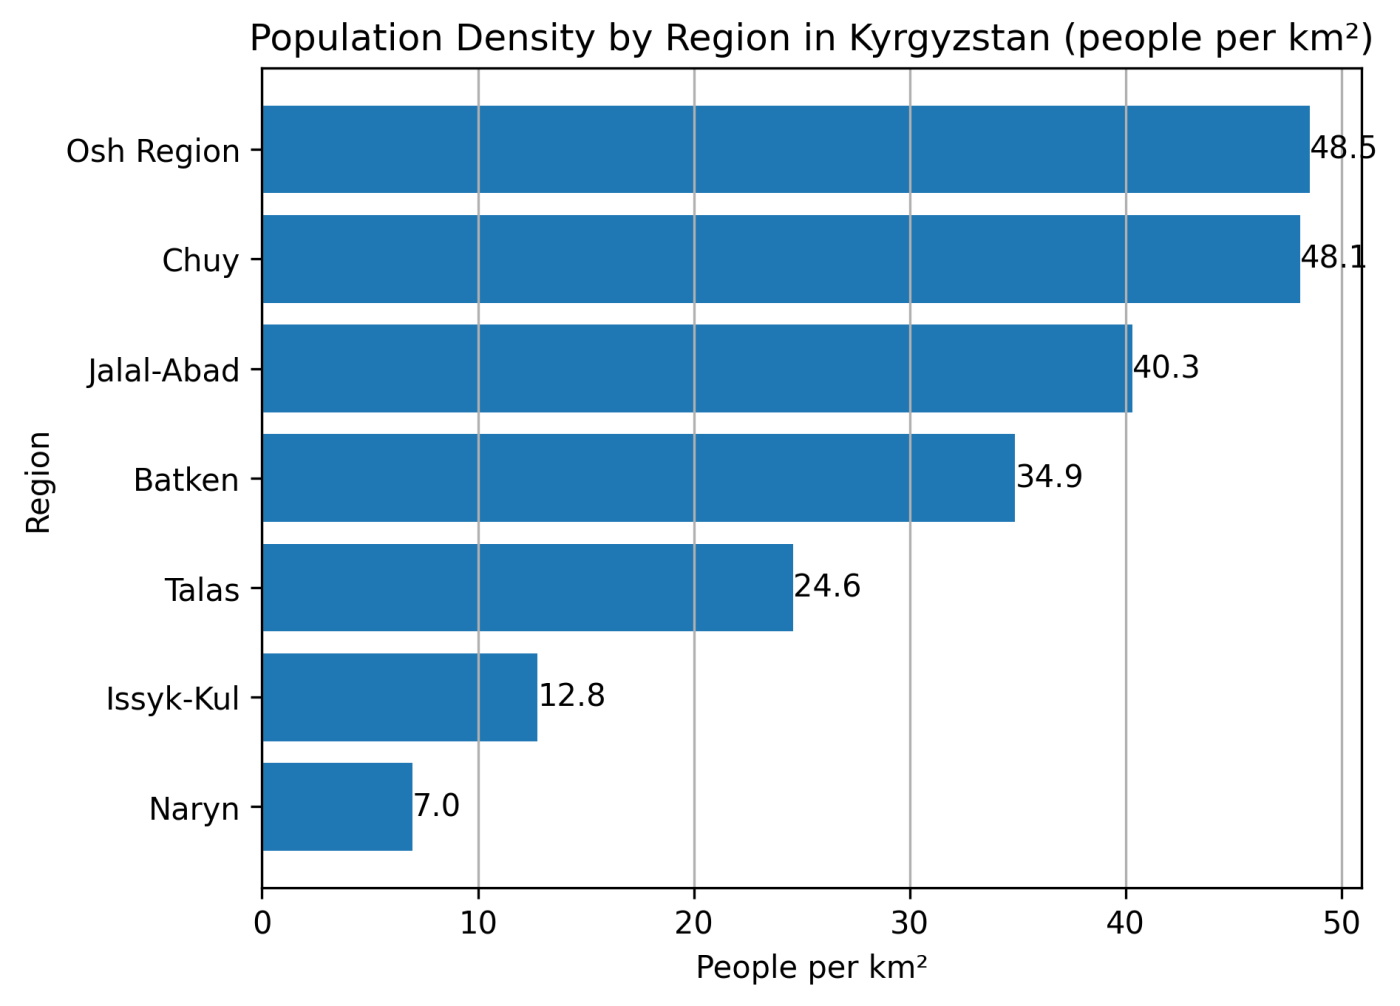
This geographic structure plays an important role in shaping migration patterns, economic development, and regional demographic trends across the country.
Urbanization in Kyrgyzstan
Although Kyrgyzstan remains a largely rural country, urbanization has gradually accelerated during the past two decades. Cities are attracting growing numbers of residents from rural regions seeking employment, education, and better infrastructure.
Bishkek stands at the center of this process. As the political and economic capital of the country, it hosts universities, government institutions, financial services, and the largest labor market in Kyrgyzstan.
Population statistics clearly show the impact of internal migration. Bishkek has experienced one of the fastest population increases in the country, growing by more than 200,000 residents between 2021 and 2025 according to official estimates.
Osh, the country’s second-largest city, has also expanded significantly. As the main urban center in southern Kyrgyzstan, it functions as a commercial hub connecting regional trade, agriculture, and cross-border commerce with neighboring Uzbekistan.
Urban growth brings both opportunities and challenges. Cities generate economic activity and attract investment, but they must also expand housing, transportation networks, and public services to accommodate rising populations.
In the coming decades, urbanization is expected to remain one of the most important demographic trends shaping Kyrgyzstan’s development.
Population Growth in Kyrgyzstan
Population growth in Kyrgyzstan is driven primarily by natural demographic dynamics rather than migration. Birth rates remain relatively high compared with many countries in Eastern Europe and Central Asia, which continues to push the population upward each year.
One of the key indicators used by demographers is natural population growth — the difference between the number of births and the number of deaths during a given year.
In Kyrgyzstan this indicator has remained strongly positive over the past decade, reflecting the country’s relatively young population structure.
Regional Demographic Differences
Population growth is not evenly distributed across Kyrgyzstan. Southern regions generally record faster demographic expansion compared with the northern part of the country.
Osh and Jalal-Abad regions together account for a large share of the country’s population growth. These areas historically maintain higher fertility rates and larger household sizes.
Northern regions such as Issyk-Kul, Naryn, and Talas show slower population increases. Geography plays an important role here. Mountain terrain limits agricultural land and economic activity, which in turn influences settlement patterns.
The Chuy region represents a special case. Although its population growth is moderate, the region benefits from proximity to Bishkek and serves as an important economic corridor for transportation, agriculture, and trade.
These regional differences shape migration flows within the country, with many young people moving from rural southern regions toward cities in search of employment opportunities.
Natural Population Growth
The following table shows natural population growth in Kyrgyzstan between 2020 and 2024.
| Year | Natural Population Growth |
|---|---|
| 2020 | 118,135 |
| 2021 | 111,289 |
| 2022 | 118,824 |
| 2023 | 114,477 |
| 2024 | 108,709 |
Although the numbers fluctuate slightly from year to year, the general pattern remains stable: Kyrgyzstan continues to experience significant natural population growth.
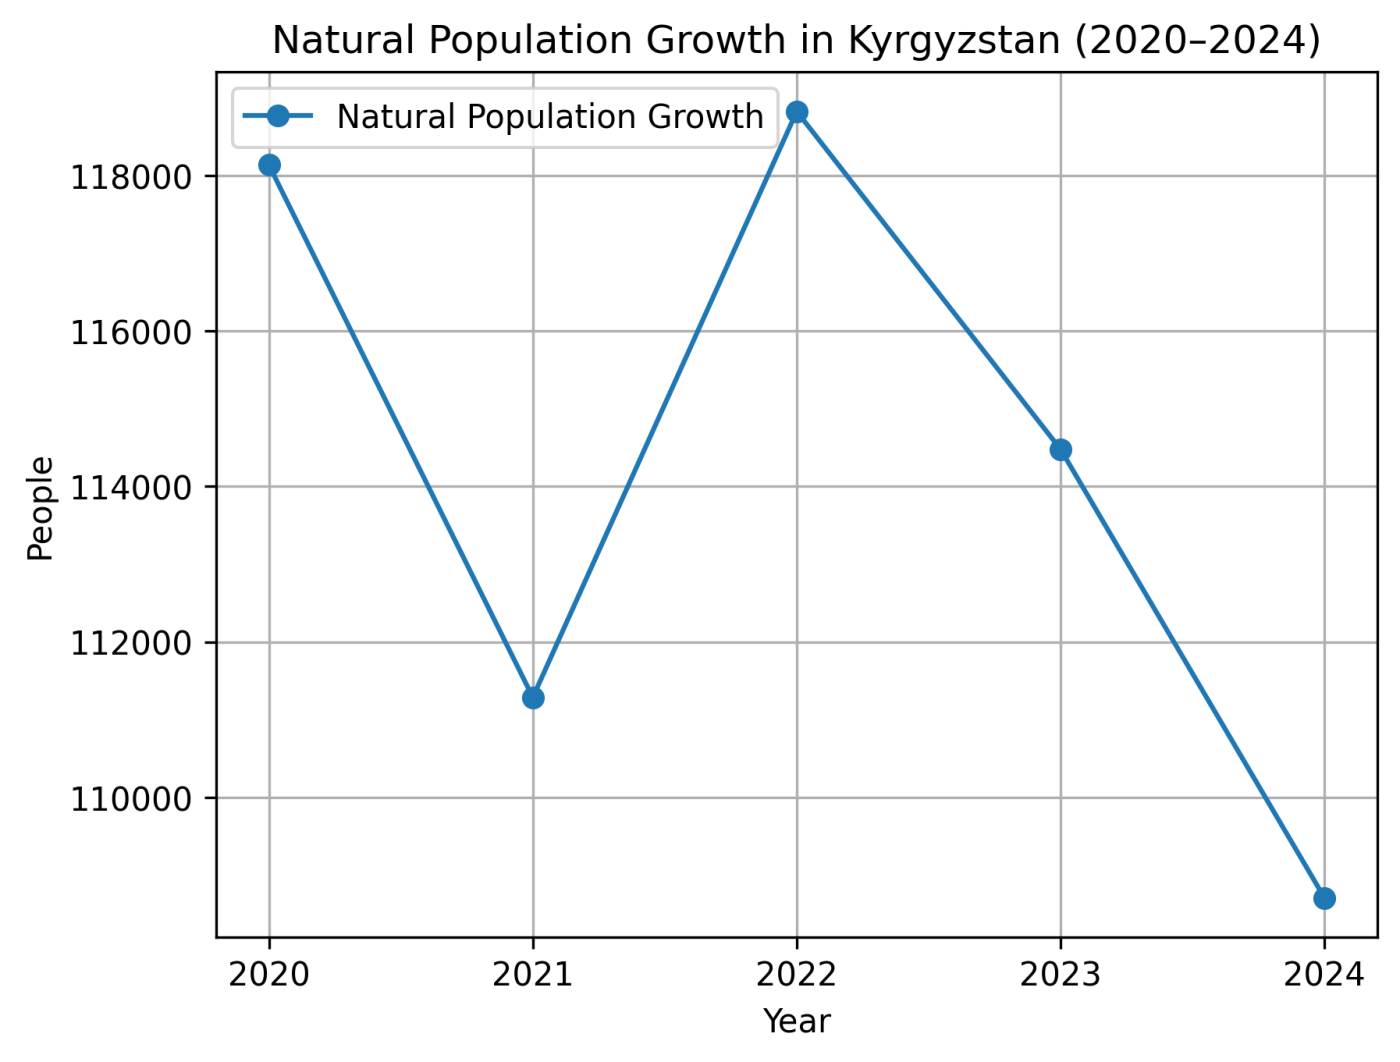
Several factors explain this demographic trend.
- Birth rates remain relatively high across much of the country.
- The population structure is young, with a large share of residents under 30.
- Life expectancy continues to increase gradually.
Southern regions such as Osh and Jalal-Abad contribute the largest share of natural population growth. These areas historically maintain higher fertility rates and larger household sizes.
Urban centers show slightly different dynamics. Cities such as Bishkek and Osh experience growth not only through natural increase but also through internal migration from rural regions.
Age Structure of the Population
One of the defining characteristics of Kyrgyzstan’s demographics is its relatively young population. Compared with many European countries where aging populations dominate demographic discussions, Kyrgyzstan maintains a large share of children and young adults.
This age structure is largely the result of consistently high birth rates over the past decades combined with improving life expectancy.
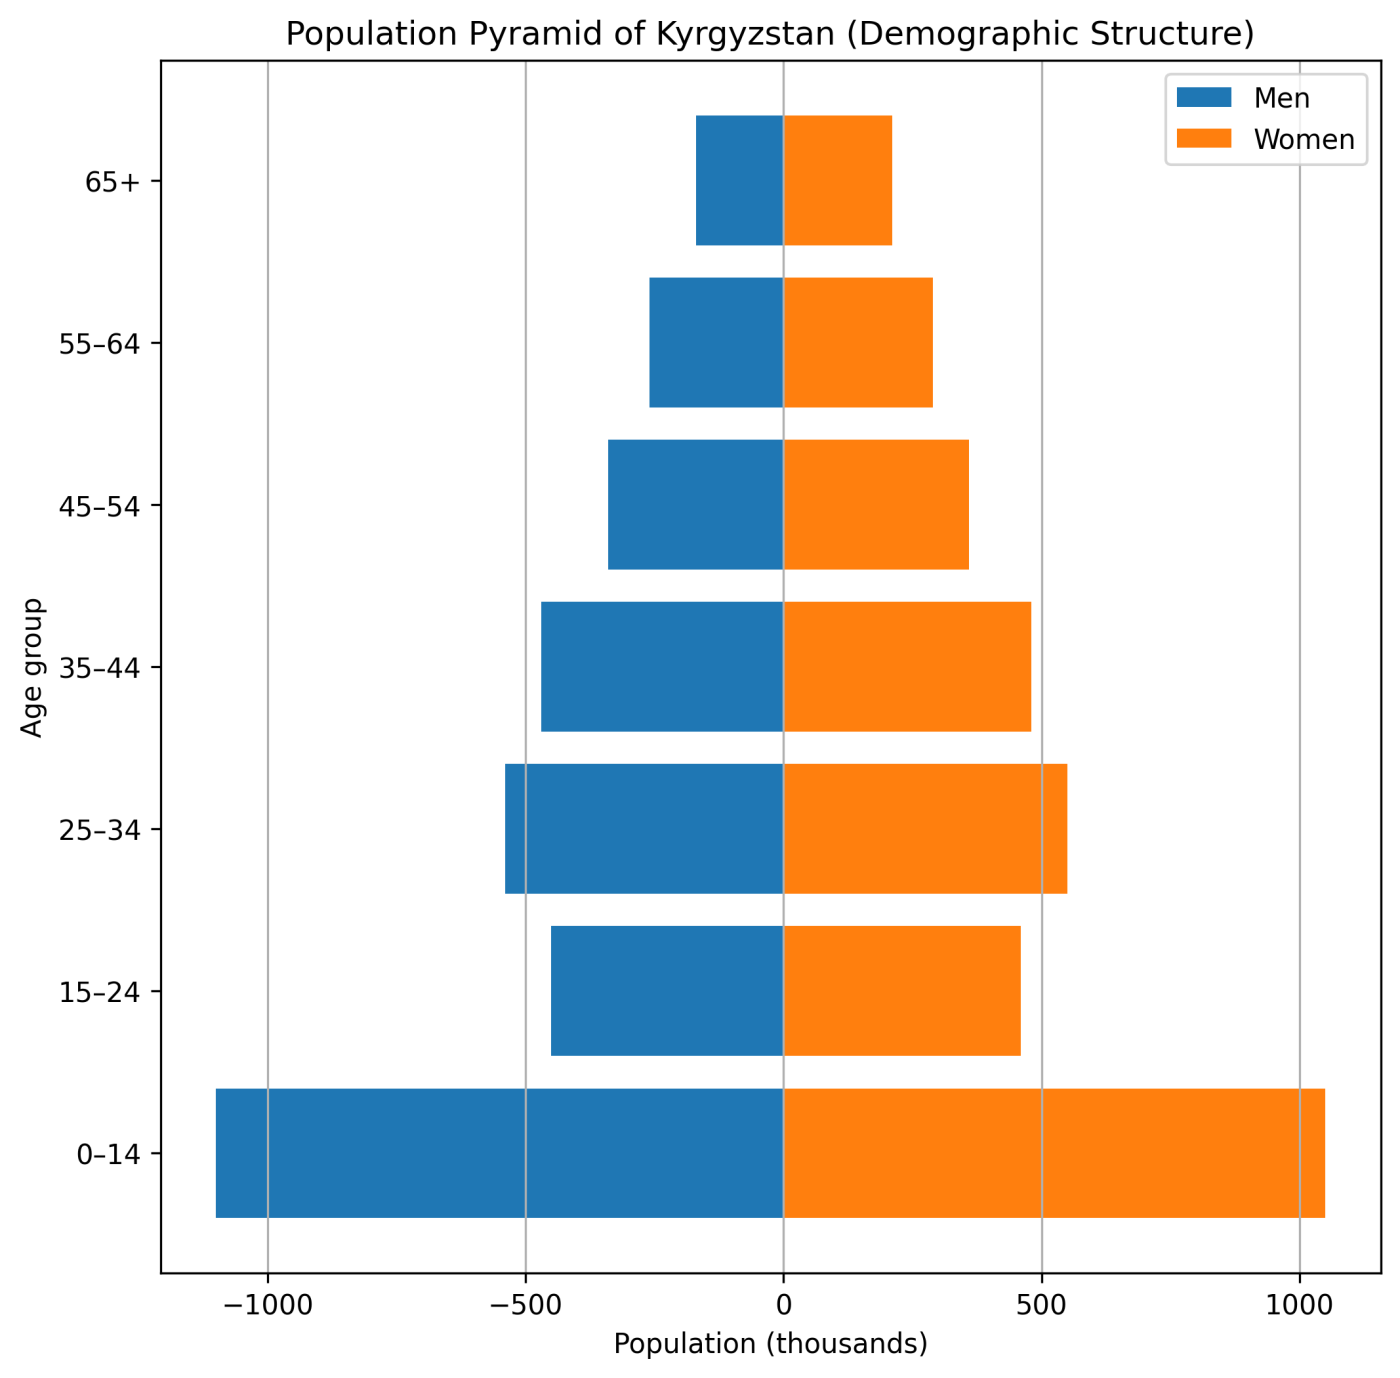
Demographers often analyze age distribution using a population pyramid, which shows the number of men and women within different age groups.
Median Age and Fertility
Kyrgyzstan remains one of the youngest countries in Central Asia. The median age of the population is roughly 25 years, significantly lower than in most European countries where median ages often exceed 40.
Another important demographic indicator is the total fertility rate, which measures the average number of children born to a woman during her lifetime. In Kyrgyzstan this indicator is estimated at about 2.7 children per woman, well above the replacement level of 2.1.
This relatively high fertility rate explains why the country continues to experience natural population growth even as migration patterns fluctuate.
Higher birth rates are especially common in southern regions such as Osh and Jalal-Abad, where household sizes tend to be larger and rural traditions remain strong.
What the Age Structure Shows
Several clear patterns appear when looking at Kyrgyzstan’s population pyramid.
- A large base of children and teenagers indicates strong birth rates in recent decades.
- The working-age population (20–40 years old) forms a substantial share of the total population.
- Older age groups remain smaller compared with many developed countries.
This demographic profile creates both opportunities and challenges for the country.
- A young population supports long-term labor force growth.
- Education systems must accommodate large numbers of students.
- Labor markets need to generate enough jobs for new entrants each year.
In many regions of Kyrgyzstan, particularly in the south, families remain larger than in urban centers. Rural areas therefore contribute significantly to the younger segments of the population.
At the same time, cities such as Bishkek attract a growing number of young adults seeking education and employment opportunities. This internal migration gradually reshapes the demographic balance between urban and rural regions.
Migration Trends in Kyrgyzstan
Migration has long played an important role in shaping Kyrgyzstan’s demographic landscape. While natural population growth remains the main driver of population increase, cross-border migration affects labor markets, family structures, and regional demographics.
For many years Kyrgyzstan experienced a negative migration balance, meaning more people left the country than arrived. However, recent statistics show a gradual shift in this pattern.
Migration Balance
Migration balance measures the difference between the number of people entering the country and those leaving it during a given year.
| Year | Migration Balance |
|---|---|
| 2020 | -4,861 |
| 2021 | -769 |
| 2022 | 5,917 |
| 2023 | 9,843 |
| 2024 | 11,208 |
The data shows a noticeable shift after 2021. Kyrgyzstan moved from a negative migration balance toward a positive inflow of residents.
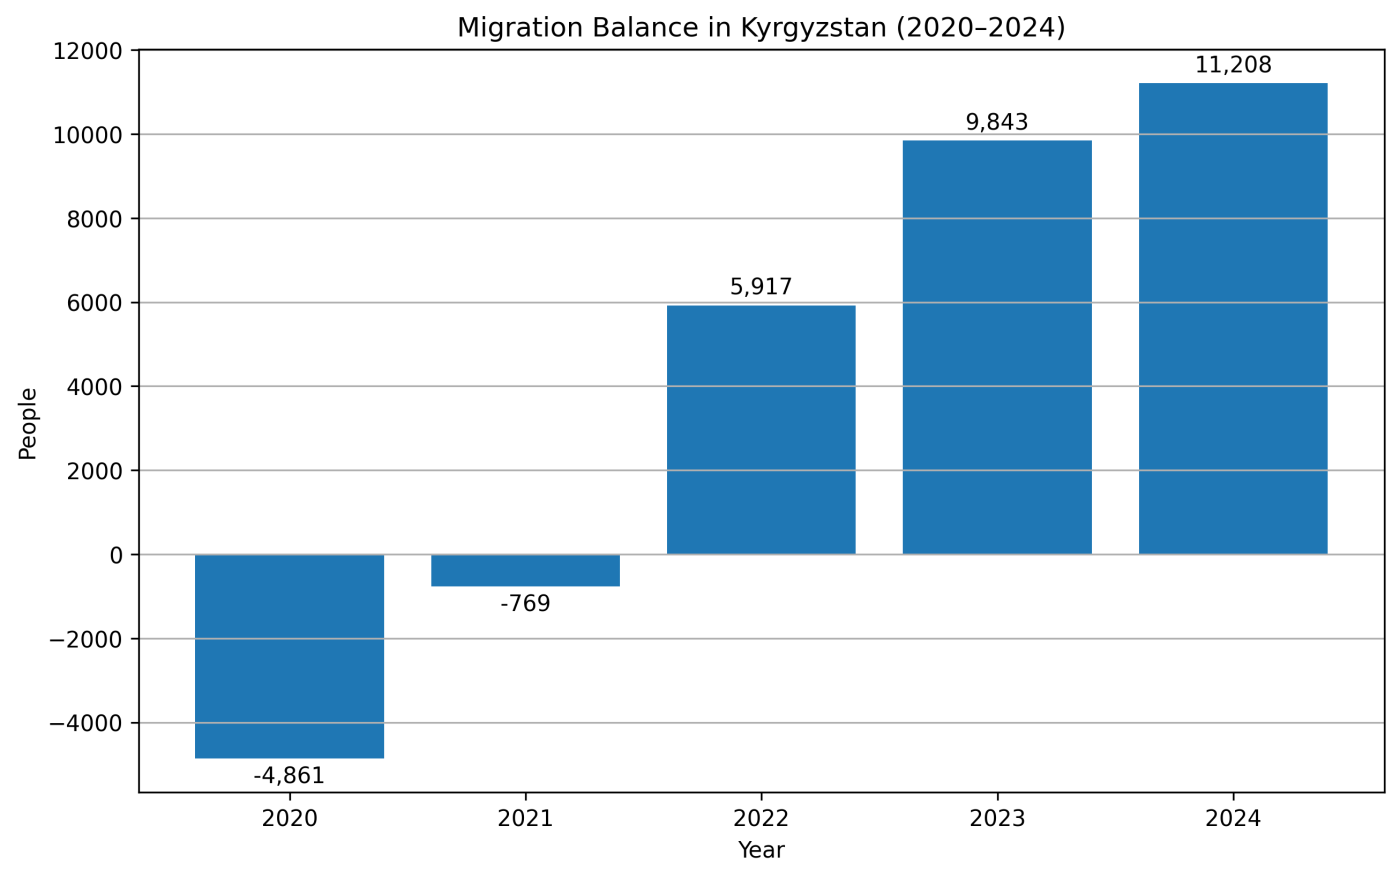
Main Migration Destinations
Historically, the largest migration corridor has connected Kyrgyzstan and Russia. Economic opportunities, labor demand, and long-standing social networks encourage many Kyrgyz citizens to work abroad.
Kazakhstan also remains an important destination due to geographic proximity and economic ties.
- Russia — the largest destination for Kyrgyz labor migrants.
- Kazakhstan — common for seasonal work and regional mobility.
- Other countries — including Germany, the United States, and Israel, represent much smaller migration flows.
Immigration to Kyrgyzstan
While outward migration often receives more attention, immigration to Kyrgyzstan has also increased in recent years. According to official statistics, the number of people arriving to settle in the country has grown steadily.
| Year | Arrivals | Departures |
|---|---|---|
| 2020 | 961 | 5,822 |
| 2021 | 8,229 | 8,998 |
| 2022 | 12,444 | 6,527 |
| 2023 | 14,453 | 4,610 |
| 2024 | 14,669 | 3,461 |
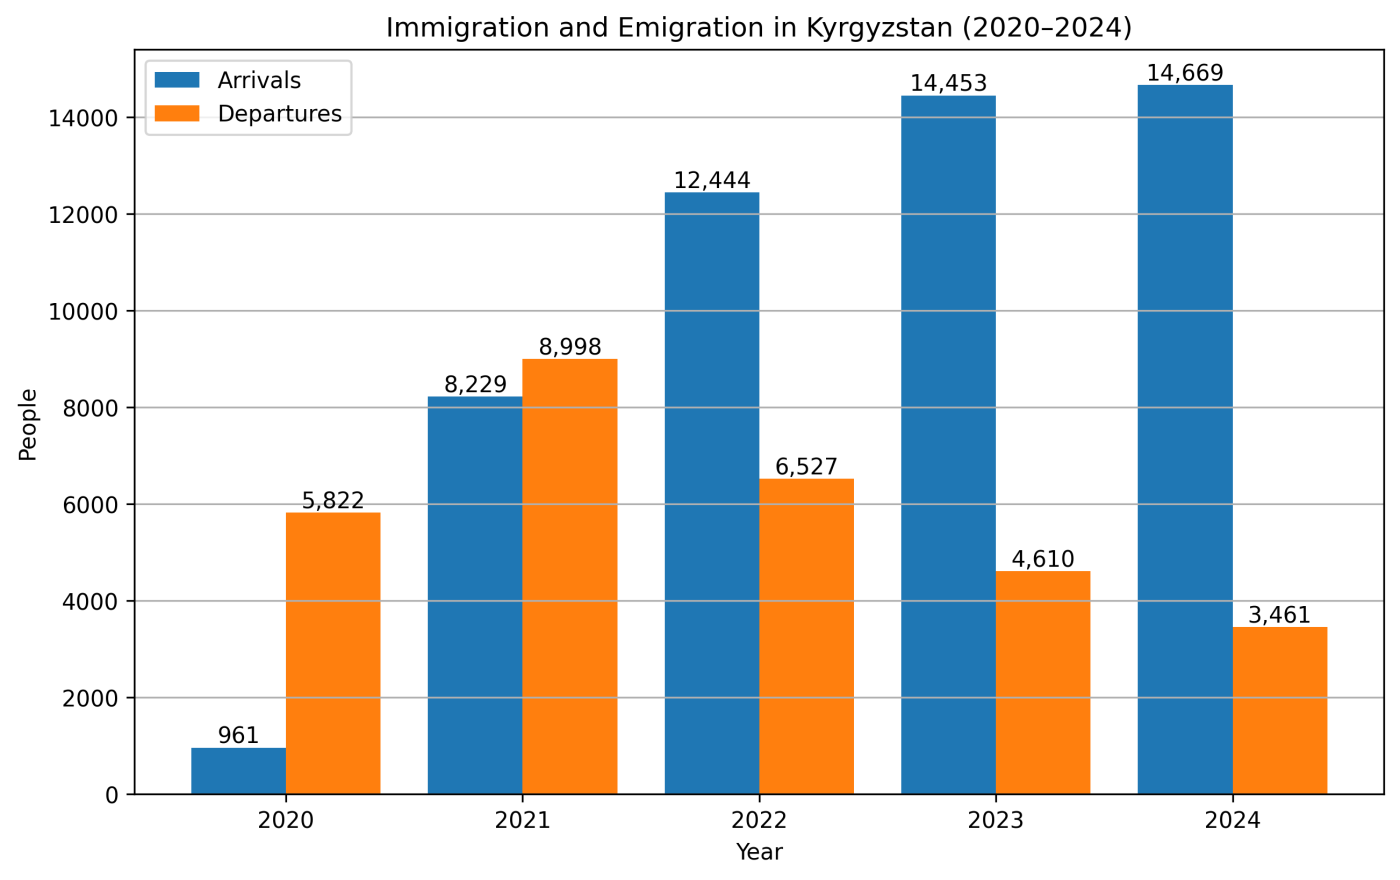
Several factors may explain this shift. Economic changes in the region, geopolitical developments, and internal labor market adjustments all influence migration flows.
Cities such as Bishkek increasingly attract newcomers due to educational institutions, employment opportunities, and business activity.
Life Expectancy in Kyrgyzstan
Life expectancy is another key indicator used to understand the demographic situation of a country. In Kyrgyzstan, average life expectancy has gradually improved over the past several years, reflecting improvements in healthcare, living standards, and public health conditions.
Like in most countries, women in Kyrgyzstan live significantly longer than men. This gender gap in life expectancy is common across much of Central Asia and Eastern Europe.
| Year | Men | Women |
|---|---|---|
| 2019 | 67.6 | 75.8 |
| 2020 | 67.8 | 76.0 |
| 2021 | 67.9 | 76.1 |
| 2022 | 68.0 | 76.3 |
| 2023 | 68.2 | 76.5 |
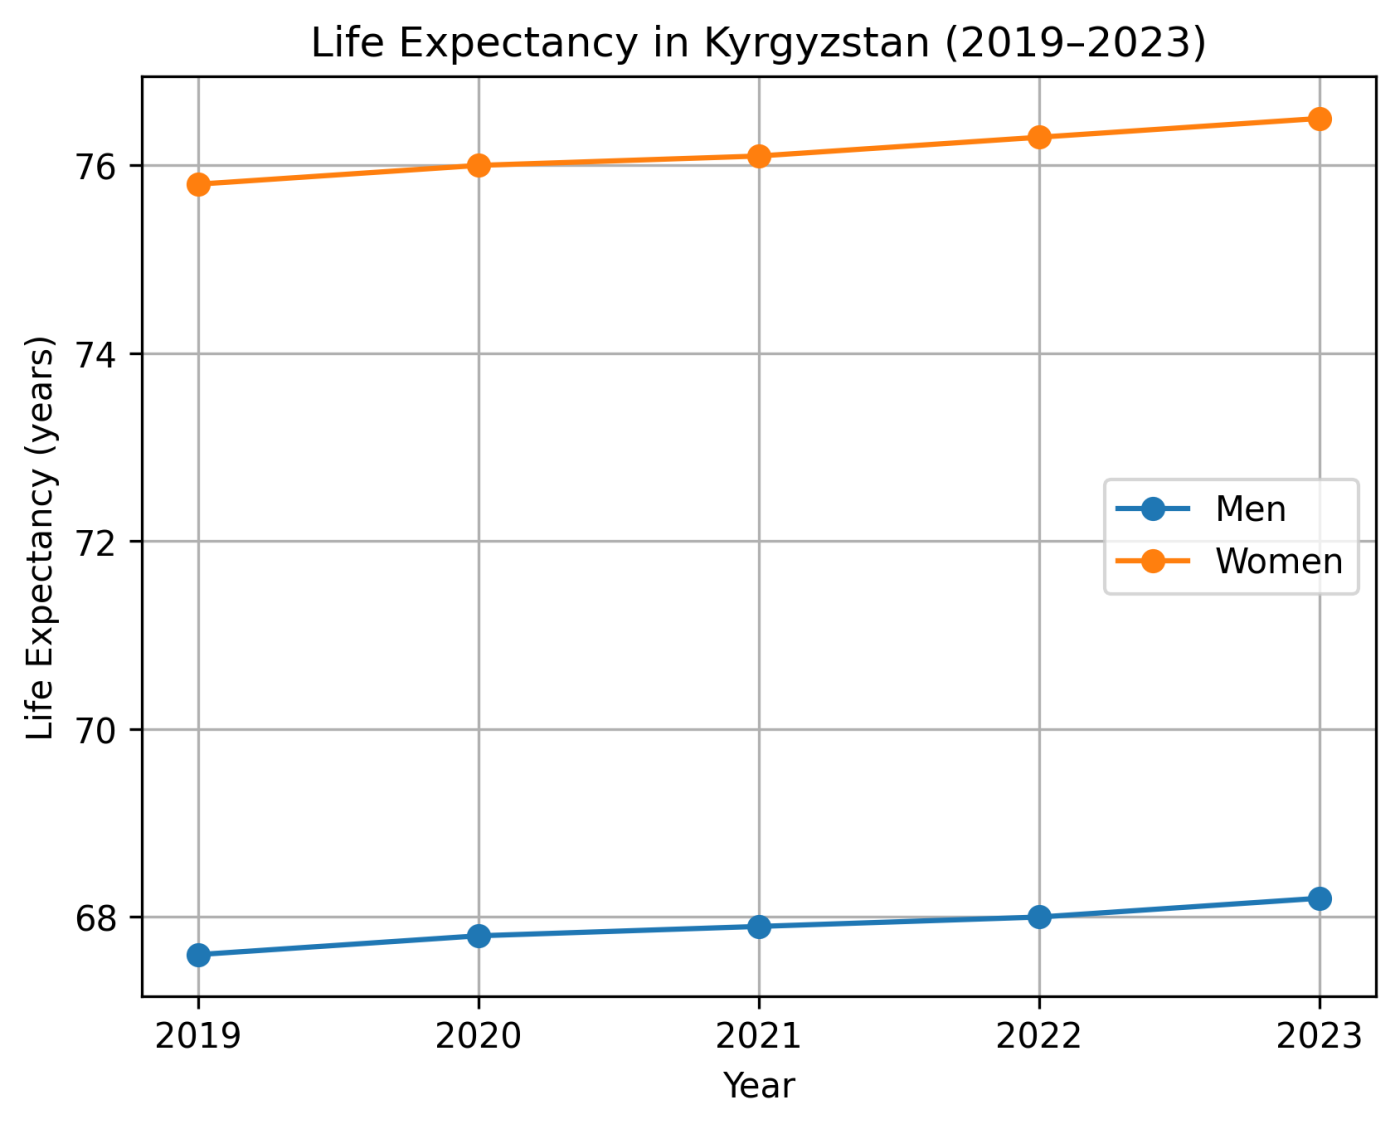
The difference between male and female life expectancy in Kyrgyzstan remains around eight years. Researchers often link this gap to occupational risks, lifestyle differences, and broader social factors.
Health and Mortality Patterns
Health indicators also influence demographic trends across Kyrgyzstan. Over the past two decades, life expectancy has improved gradually due to better healthcare access and public health programs.
The average life expectancy in the country reached approximately 72 years in recent estimates. Women live significantly longer than men, with an average gap of around eight years between the sexes.
Cardiovascular disease remains the leading cause of death in the country, followed by respiratory illnesses and other chronic conditions.
Despite these challenges, improvements in medical services and living standards have contributed to a gradual increase in longevity.
Marriage Statistics
Family formation patterns provide another perspective on demographic trends. Marriage remains a central social institution in Kyrgyz society, and the number of marriages each year reflects both cultural traditions and economic conditions.
| Year | Marriages |
|---|---|
| 2020 | 39,747 |
| 2021 | 50,747 |
| 2022 | 48,232 |
| 2023 | 45,495 |
| 2024 | 45,033 |
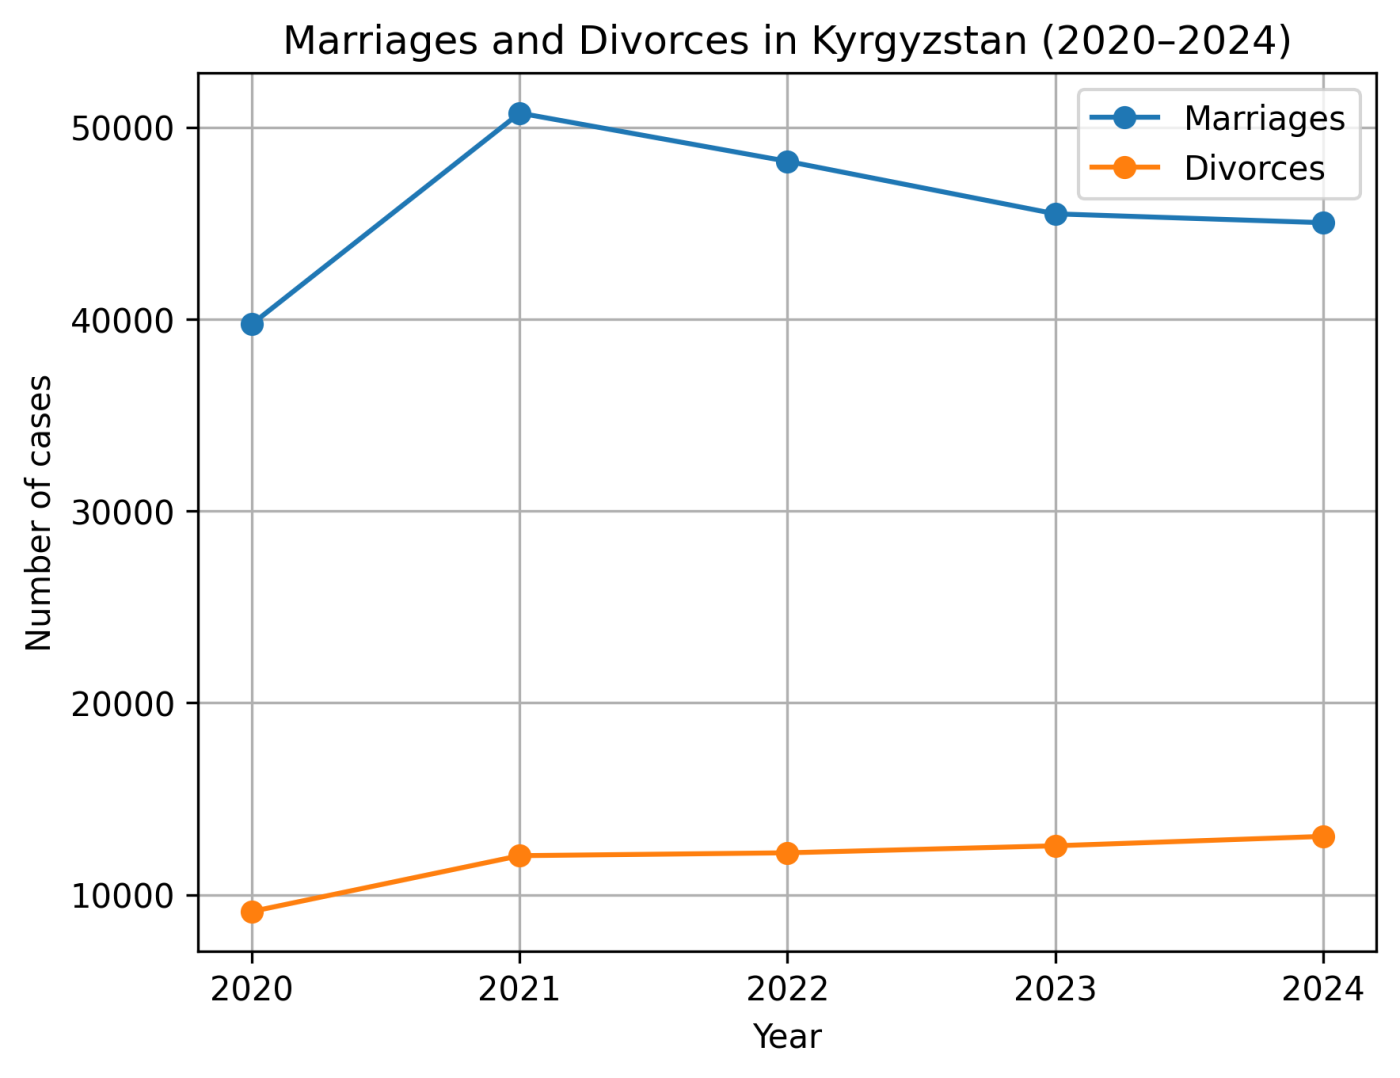
After a sharp increase in 2021, the number of marriages stabilized in subsequent years. Such fluctuations often reflect broader economic cycles as well as demographic waves among younger age groups.
Divorce Trends
Divorce rates have also increased gradually over time, reflecting changing social dynamics and shifting attitudes toward marriage.
| Year | Divorces |
|---|---|
| 2020 | 9,128 |
| 2021 | 12,037 |
| 2022 | 12,187 |
| 2023 | 12,552 |
| 2024 | 13,042 |
Despite this increase, marriage rates remain significantly higher than divorce rates, and family structures continue to play a central role in Kyrgyz society.
Demographic Outlook
Taken together, Kyrgyzstan’s demographic indicators reveal a country with a relatively young population, steady natural growth, and gradually changing migration dynamics.
- The population continues to grow each year.
- Birth rates remain strong compared with many neighboring countries.
- Urban centers such as Bishkek are expanding rapidly due to internal migration.
- Life expectancy continues to increase slowly.
These trends will likely shape Kyrgyzstan’s social and economic development in the coming decades, influencing labor markets, education systems, and urban growth.
Sources and Data
Demographic data for Kyrgyzstan is compiled from several national and international statistical sources. These institutions collect and publish population statistics, migration records, and social indicators used in research and policy analysis.
Because Kyrgyz demographic indicators are published with different reference years, the latest available year in this article varies by dataset.
- National Statistical Committee of the Kyrgyz Republic – official demographic statistics including population distribution, natural growth, migration, and social indicators. stat.gov.kg
- World Bank Data – international demographic datasets including population size, growth rates, and fertility indicators. data.worldbank.org
- UN Data – population indicators, demographic structure, and international comparisons. data.un.org
- CEIC Data – aggregated economic and demographic indicators for Kyrgyzstan. ceicdata.com
- Trading Economics – economic and demographic indicators compiled from global statistical sources. tradingeconomics.com
These datasets are widely used by researchers, journalists, and international organizations analyzing demographic trends in Central Asia.